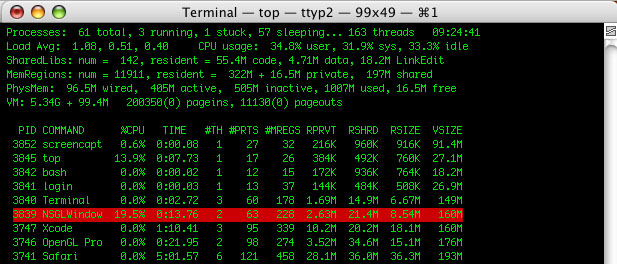
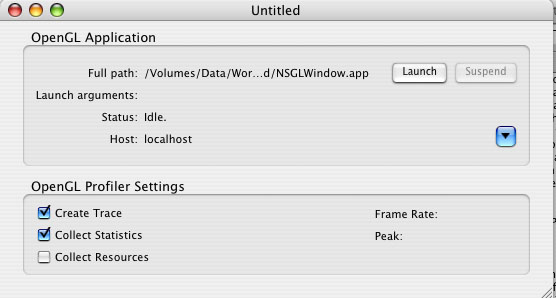
IntroductionOptimization of OpenGL code has become an increasingly important activity in the development of OpenGL-based applications. This document is targeted towards OpenGL developers who are looking to improve the performance of their applications. Developers should have a fundamental knowledge of OpenGL programming and a familiarity with OpenGL on Mac OS X to fully utilize and understand the information presented here. Before diving into code to start performance tuning an OpenGL application, it is best to examine the fundamentals of OpenGL optimization and develop a systematic approach to enhancing the performance of OpenGL applications. One of the first things to do is to launch the application (in a window, if possible) and run the 'top' command in a terminal window. This is the starting point for almost all performance analysis, as it indicates how much CPU time an application is using. This information can also be garnered from the CHUD tool 'Shark', however Shark could be considered somewhat overkill for this stage of the process. The idea here is to yield a baseline value for further tuning of OpenGL. Following this would be running the application through the OpenGL Profiler and collecting statistics of how and where the application is spending its time with regards to OpenGL. Once these two quantities known, the actual amount of time spent in OpenGL can be used in conjunction with the amount CPU time in use to yield an approximate value for performance. These approximate times will allow the developer to first see how much CPU time the application is using and how much of that time is actually being spent in OpenGL. The Performance Tuning Roadmap
Understanding OpenGL PerformancePerhaps the most important aspect of OpenGL performance is how it relates to overall application performance. Using the above data from the NSGLWindow sample, 19.5% of available CPU time is being used by the application. Of this 19.5%, 14.25% is being spent in OpenGL, while the remainder is being used by the application itself. The following equation illustrates the relationship of OpenGL performance to application performance: Total OpenGL Performance Increase = (Total CPU Time Consumed) * (Percentage of Time Spent In OpenGL) Placing the generated data into this equation yields the following results: Total OpenGL Performance Increase = (19.5) * (14.25%) = 2.77875% Note: The actual numerical values you place in a calculator are not the same as listed above. The real numbers would be these: 19.5 * (0.1425) = 2.77875 as you are taking a percentage of a percentage to yield a real-world value. With this in mind, even if OpenGL were to become a total 'no op' (taking 0 time), the application would only see a 2.78% increase in performance. So if an application were running at 60 frames per second, it would then perform as follows: New Framerate = Previous FPS * (1 + (Percent Performance Increase) = 60fps * (1.0278) = 61.67fps The application has gained slightly less than 2 frames per second by reducing OpenGL from 15% to 0%. This clearly shows that the relationship of OpenGL performance to application performance is not linear and that simply reducing the amount of time spent in OpenGL may or may not offer any noticeable benefit in application performance. Note: It is impractical to think that an OpenGL application can actually have zero CPU utilization and still do something marginally useful. The idea of reducing the overhead of OpenGL to zero is a strictly for demonstrating the concepts behind OpenGL optimization. The following figure offers a graphical representation of the information presented above. It shows the relationship between OpenGL performance and overall application performance as well as how to determine the real-world values for performance data.
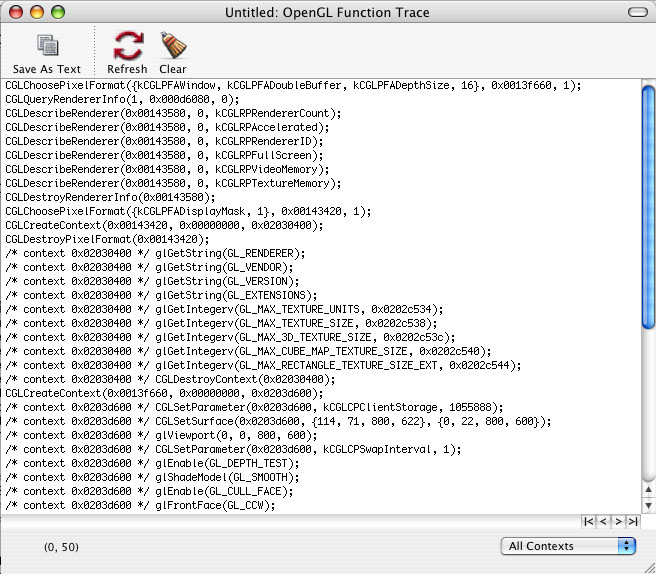
The scenario illustrated by the graphic above is a little more likely to be found in the real world, where OpenGL is taking up about 25% of the CPU time used by the application. The actual amount of time used is absent in this illustration, as it is not entirely necessary to demonstrate the concept. The idea here is that regardless of how much actual time is used by the application, OpenGL is taking only a relatively small percentage (25%) of that time while the application is using the remainder (75%). Use Profiler, Driver Monitor and CHUD ToolsThe previous section offered some tips and instructions for using the OpenGL Profiler to collect performance data for an OpenGL application. With Profiler, developers can see how much time is being spent in OpenGL, in which functions that time is being spent and function call traces for the application being analyzed. OpenGL Profiler contains many more features and functions, not just the ones mentioned previously. For a more complete description of the OpenGL Profiler, please visit the OpenGL Profiler web page. These three tools, included with the Mac OS X Developer Tools installation, are of paramount importance when performance tuning OpenGL applications. They are capable of tracking down and illustrating many of the common performance problems found in OpenGL applications. Instead of duplicating a great deal of information in this document regarding these tools, included below is a list of links to the appropriate tools documentation. When using Profiler, there are a couple things to keep in mind. The following is a short list of items to keep in mind when you start working with Profiler:
The OpenGL Driver Monitor can be overwhelming at first, so to get a better grasp on the data displayed, please take a look at the OpenGL Driver Monitor Decoder Ring. This document describes in moderate detail the various aspects of Driver Monitor and some of the more important statistics that can be examined within the application. For information on Driver Monitor itself, please visit the OpenGL Driver Monitor web page.
In this image of Driver Monitor running simultaneously with an OpenGL application, virtually all of the parameters and states of the driver can be viewed and analyzed. In this particular example, there are 4 different items currently being tracked by Driver Monitor; bufferSwapCount, The CHUD Tools are a suite of tools designed to assist developers in optimizing their code on Mac OS X. With regards to OpenGL applications, Shark is perhaps the most useful of these tools. Shark is a performance analysis tool that can help developers determine the location of performance problems at the code level. For more information on Shark, please reference the Using Shark documentation. Finding and eliminating duplicate function calls and redundant state changesOne of the primary culprits for OpenGL performance issues is duplicate function calls. There are many forms of this particular problem, including redundant state settings and multiple flushes or swaps in a single frame. For instance, if one were enabling lighting with a call such as It is important to understand that OpenGL does not perform any type of consistency checks or redundant state set checks. For instance, as in the example above, if a call is made such as State changes in OpenGL tend to be expensive and should be broken out into separate initialization or configuration routines. Placing these calls in draw loops, or functions executed by the drawing loops, has the effect of slowing down OpenGL performance due to unnecessary changes in state. Due to the fact that OpenGL is performance-minded, no conditional or error checking is performed on incoming state changes, so these calls will cost just as many cycles for redundant entries as they would for changing data. As an example, the NSGLWindow sample was modified to include redundant
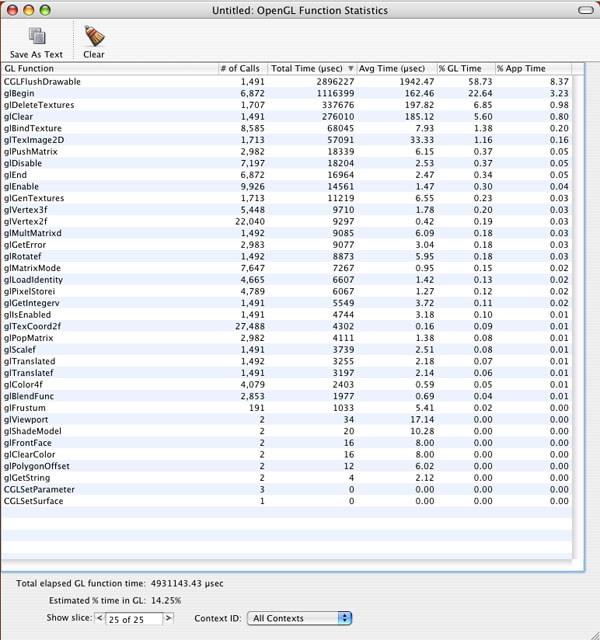
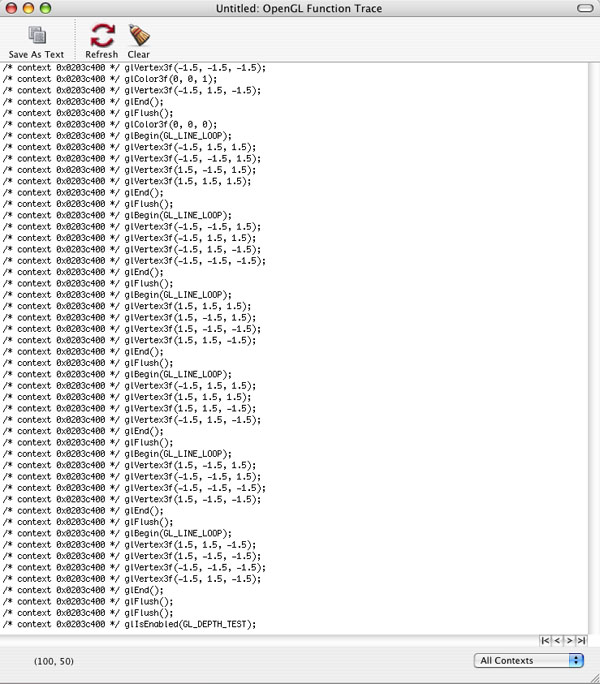
On first glance, the initial reaction could be that the application's drawing loop is being overdriven (large blocks of time spent in CGLFlushDrawable() are often an indication of such an event). Even so, glBegin() and glDeleteTextures() are both using more time in OpenGL than the command that we've duplicated.
Notice the number of
Now that the redundant It is interesting to note that based on the performance statistics in the last screenshot versus the previous statistics, glBegin() has increased by 5%. The reason for this is that in relation to the rest of the function calls, glBegin() is now taking up a larger percentage of that time, not that it is consuming more time itself. Effective use of glFlush() and glFinish()These two commands are both used to do essentially the same thing, that being to submit all queued OpenGL commands to the hardware for execution. The major difference between the two is that Problems centered around these two function calls are usually easy to track down. Incorrect use of these commands can cause stalls and slow downs, which inevitably result in poor application performance. This is usually displayed as stuttering, sluggish response and high levels of CPU utilization. A quick look through the statistics report from OpenGL Profiler should show where the problems lie, if As one can imagine, While the effect of
Notice now that the most time-consuming function is Don't try to overdrive the graphics pipeline (with rendering timers)Another common performance issue is an application's attempt to overdrive the drawing loops. This is normally done through the use of a timer that fires in rapid succession, calling the drawing loop each time it fires. Typically, the timer interval has been set to some exceptionally small value (such as 0.001 to yield 1000 executions per second). The effect of this is quite the opposite from what is often expected - CPU time is consumed at double or triple (sometimes much higher) what it would or should normally be and application performance is severely degraded. In this situation, it's best to either allow the system to regulate drawing (using For more detail on this subject as well as a short code example, please see the NSTimers and Rendering Loops document. The code listed there offers a clear illustration of proper architecture of a rendering loop in Cocoa that driven by an NSTimer with a reasonable fire interval. Understanding VSYNCHApplications are usually synchronized with the vertical refresh (VBL, vertical blank or vsynch) in order to eliminate the problem of frame tearing. Frame tearing is a situation where part of a following frame overwrites previous frame data in the frame buffer before that frame has fully been rendered on the screen. The visual effect of this is that one will see perhaps half (more or less depending on the situation) of the new frame and remainder of the previous frame. Synchronizing to the vertical refresh eliminates this problem by only drawing a frame during the vertical retrace (when the electron gun is returning to its start point). This guarantees that only 1 frame will be drawn per screen refresh. There are some caveats to doing this, however. First, the refresh only happens in integer factors of the current refresh rate of the monitor (60Hz, 30Hz, 15Hz, etc). The problem here is that OpenGL will block while waiting for the next vertical retrace which tends to waste time that could be spent performing other drawing operations. Note: LCD screens do not have a "vertical retrace" in the conventional sense and are commonly seen to have a "fixed" refresh rate of 60Hz. Reading pixels from the frame buffer
As an alternative to Concluding RemarksIn conclusion, the above information should offer a solid foundation upon which to build a fast, optimized OpenGL application on Mac OS X. The important thing to remember here is that this is really the "tip of the iceberg", so to speak, and that there are numerous other methods and techniques that can be employed to further enhance application performance. Another issue to keep in mind is that all applications do not drive the graphics pipeline in the same manner, therefore different optimization techniques can be necessary depending on how the application is architected and how it is handling rendering. Reference SectionOpenGL Driver Monitor Decoder Ring Also, the OpenGL presentations from previous WWDC sessions are extremely valuable references for OpenGL performance. These are available on DVD to all developers who attend the conference. Document Revision History
Posted: 2004-12-01 |